← The Distribution of Towns | Agricultural Valleys →
QUOTE
… the distribution of towns required to make a balanced region—02-the-distribution-of-towns—can be further helped by controlling the balance of urban land and open countryside within the towns and cities themselves.
Notes
Someday, I’ll write APL notes for without resorting to graphs — but not this time!
Public Opinion: Urban & Rural
I’m particularly interested in a section where they quote a 1972 Gallup poll that asks the question:
QUESTION
If you could live anywhere, would you prefer a city, suburban area, small town, or farm?
— Gallup, 1972
Citing the results directly from the text:
| Locale | Percent |
|---|---|
| City | 13 % |
| Suburb | 13 |
| Small Town | 32 |
| Farm | 23 |
A fun fact about polling — they often ask the same (or similar questions) across long periods of time. That’s precisely what makes polls valuable! It seems that the Gallup question has changed a bit since 1972, but I can find similar data from Gallup as recently as 2020:
QUESTION
If you could live anywhere you wished, where would you prefer to live — in a big city, small city, suburb of a big city, suburb of a small city, town or rural area?
— Gallup, 2001 - 2020
This question has been asked 3 times (that I found) since they modified it from the pre-2001 version. However, they’ve only asked it three times, and the data is… tricky. Of those three times, two directly coincide with events that would massively shake up sentiments on the issue. Specifically:
- October 19-21, 2001: In the immediate aftermath of 9/11; and
- December 1-17, 2020: Nine months into the outbreak of COVID-19.
A single datapoint in November of 2018 seems to be the only “normal” modern benchmark for the question.
For the purposes of this analysis (and to compare, as closely as possible, apples to apples), I’m going to be adding big city // small city into city and suburb of big city // suburb of small city into single results, mapping town to small town, and mapping farm to rural area.1 That gives us a grid of:
| 1972 | 2001 | 2018 | 2020 | |
|---|---|---|---|---|
| City | 13 % | 23 % | 29 % | 27 % |
| Suburb | 13 | 29 | 31 | 25 |
| Small Town | 32 | 12 | 12 | 17 |
| Rural Area | 23 | 35 | 27 | 31 |
Measuring differences, with 1972 as a baseline:
| 1972 | 2001 | 2018 | 2020 | |
|---|---|---|---|---|
| City | 13% | +10 % | +6 % | -2 % |
| Suburb | 13 | +16 | +2 | -6 |
| Small Town | 32 | -20 | — | +5 |
| Rural Area | 23 | +12 | -8 | +4 |
So, there are pretty dramatic differences in polling responses. Of course, a lot of this will need to track with actual demographic data, trying to find a shift of people into areas within these categories over time, which would be a larger project. It’d be worth putting in a separate note at some point, but I’ll pile that onto the “do later, when there’s time” pile.
Other Notes
As for the rest of this — I do understand the sentiment! I joke with people that I’m a real indoorsman, but my partner is very much the opposite. Utah has been a boon for her — she loves living in a city that sits so close to the outdoors. That is a major draw for the folks that live here.
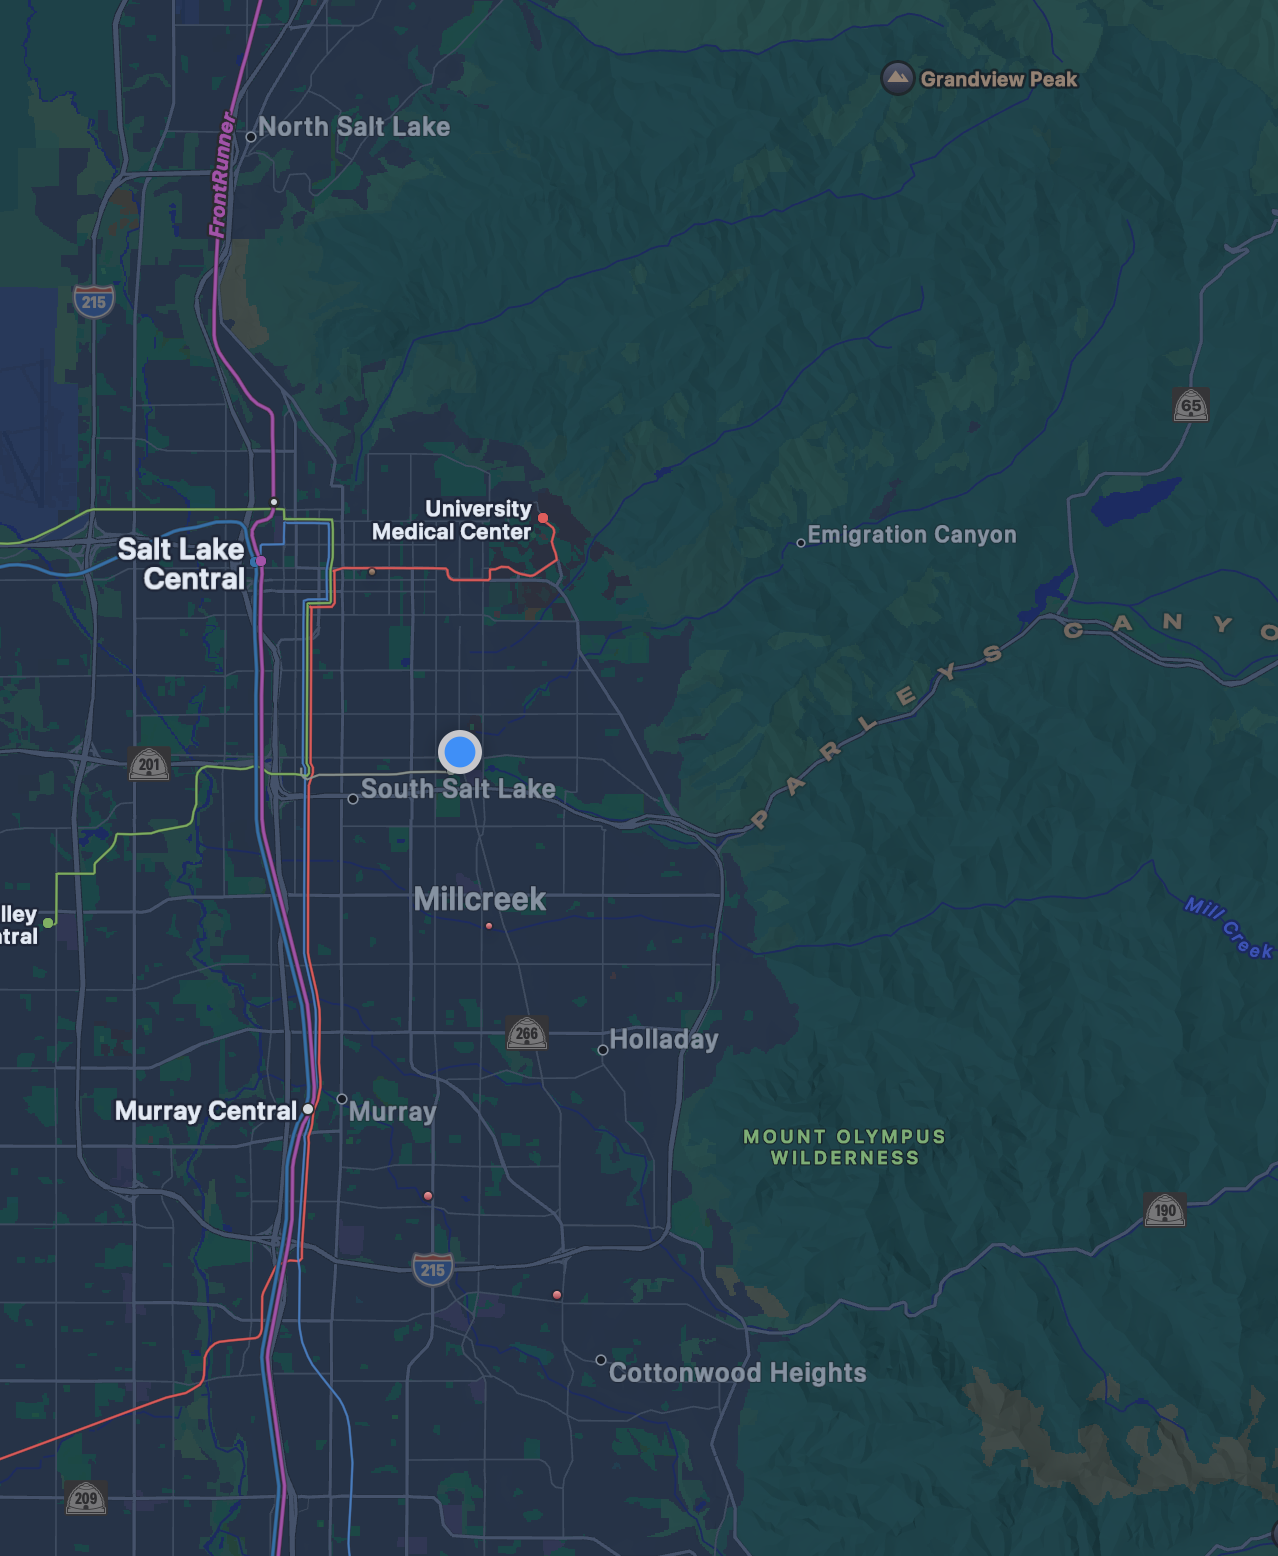
In this setting, though, I’m having a hard time properly visualizing their concept of city-country fingers.
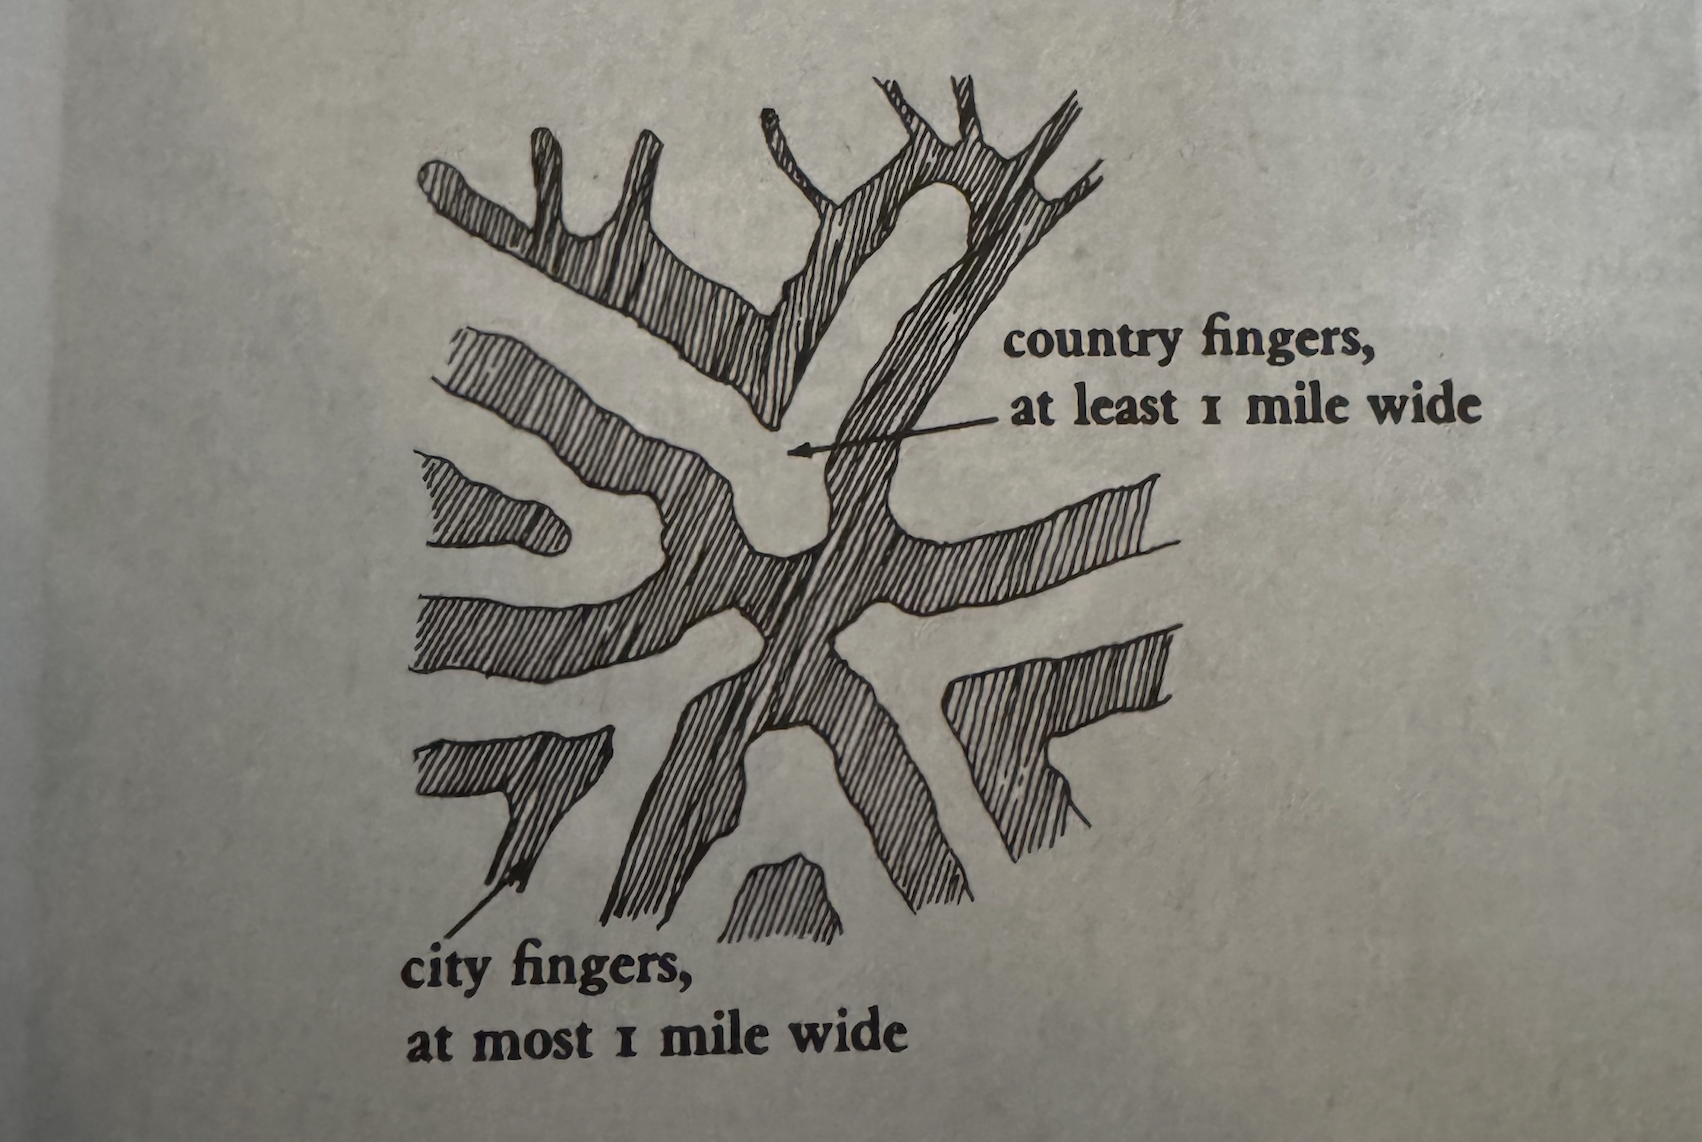
Part of this is that Salt Lake City sits on the Wasatch Front, a large stretch of area parallel to the Wasatch Mountains. To some extent, the entire valley is a single massive city finger, adjacent to a single massive country finger.
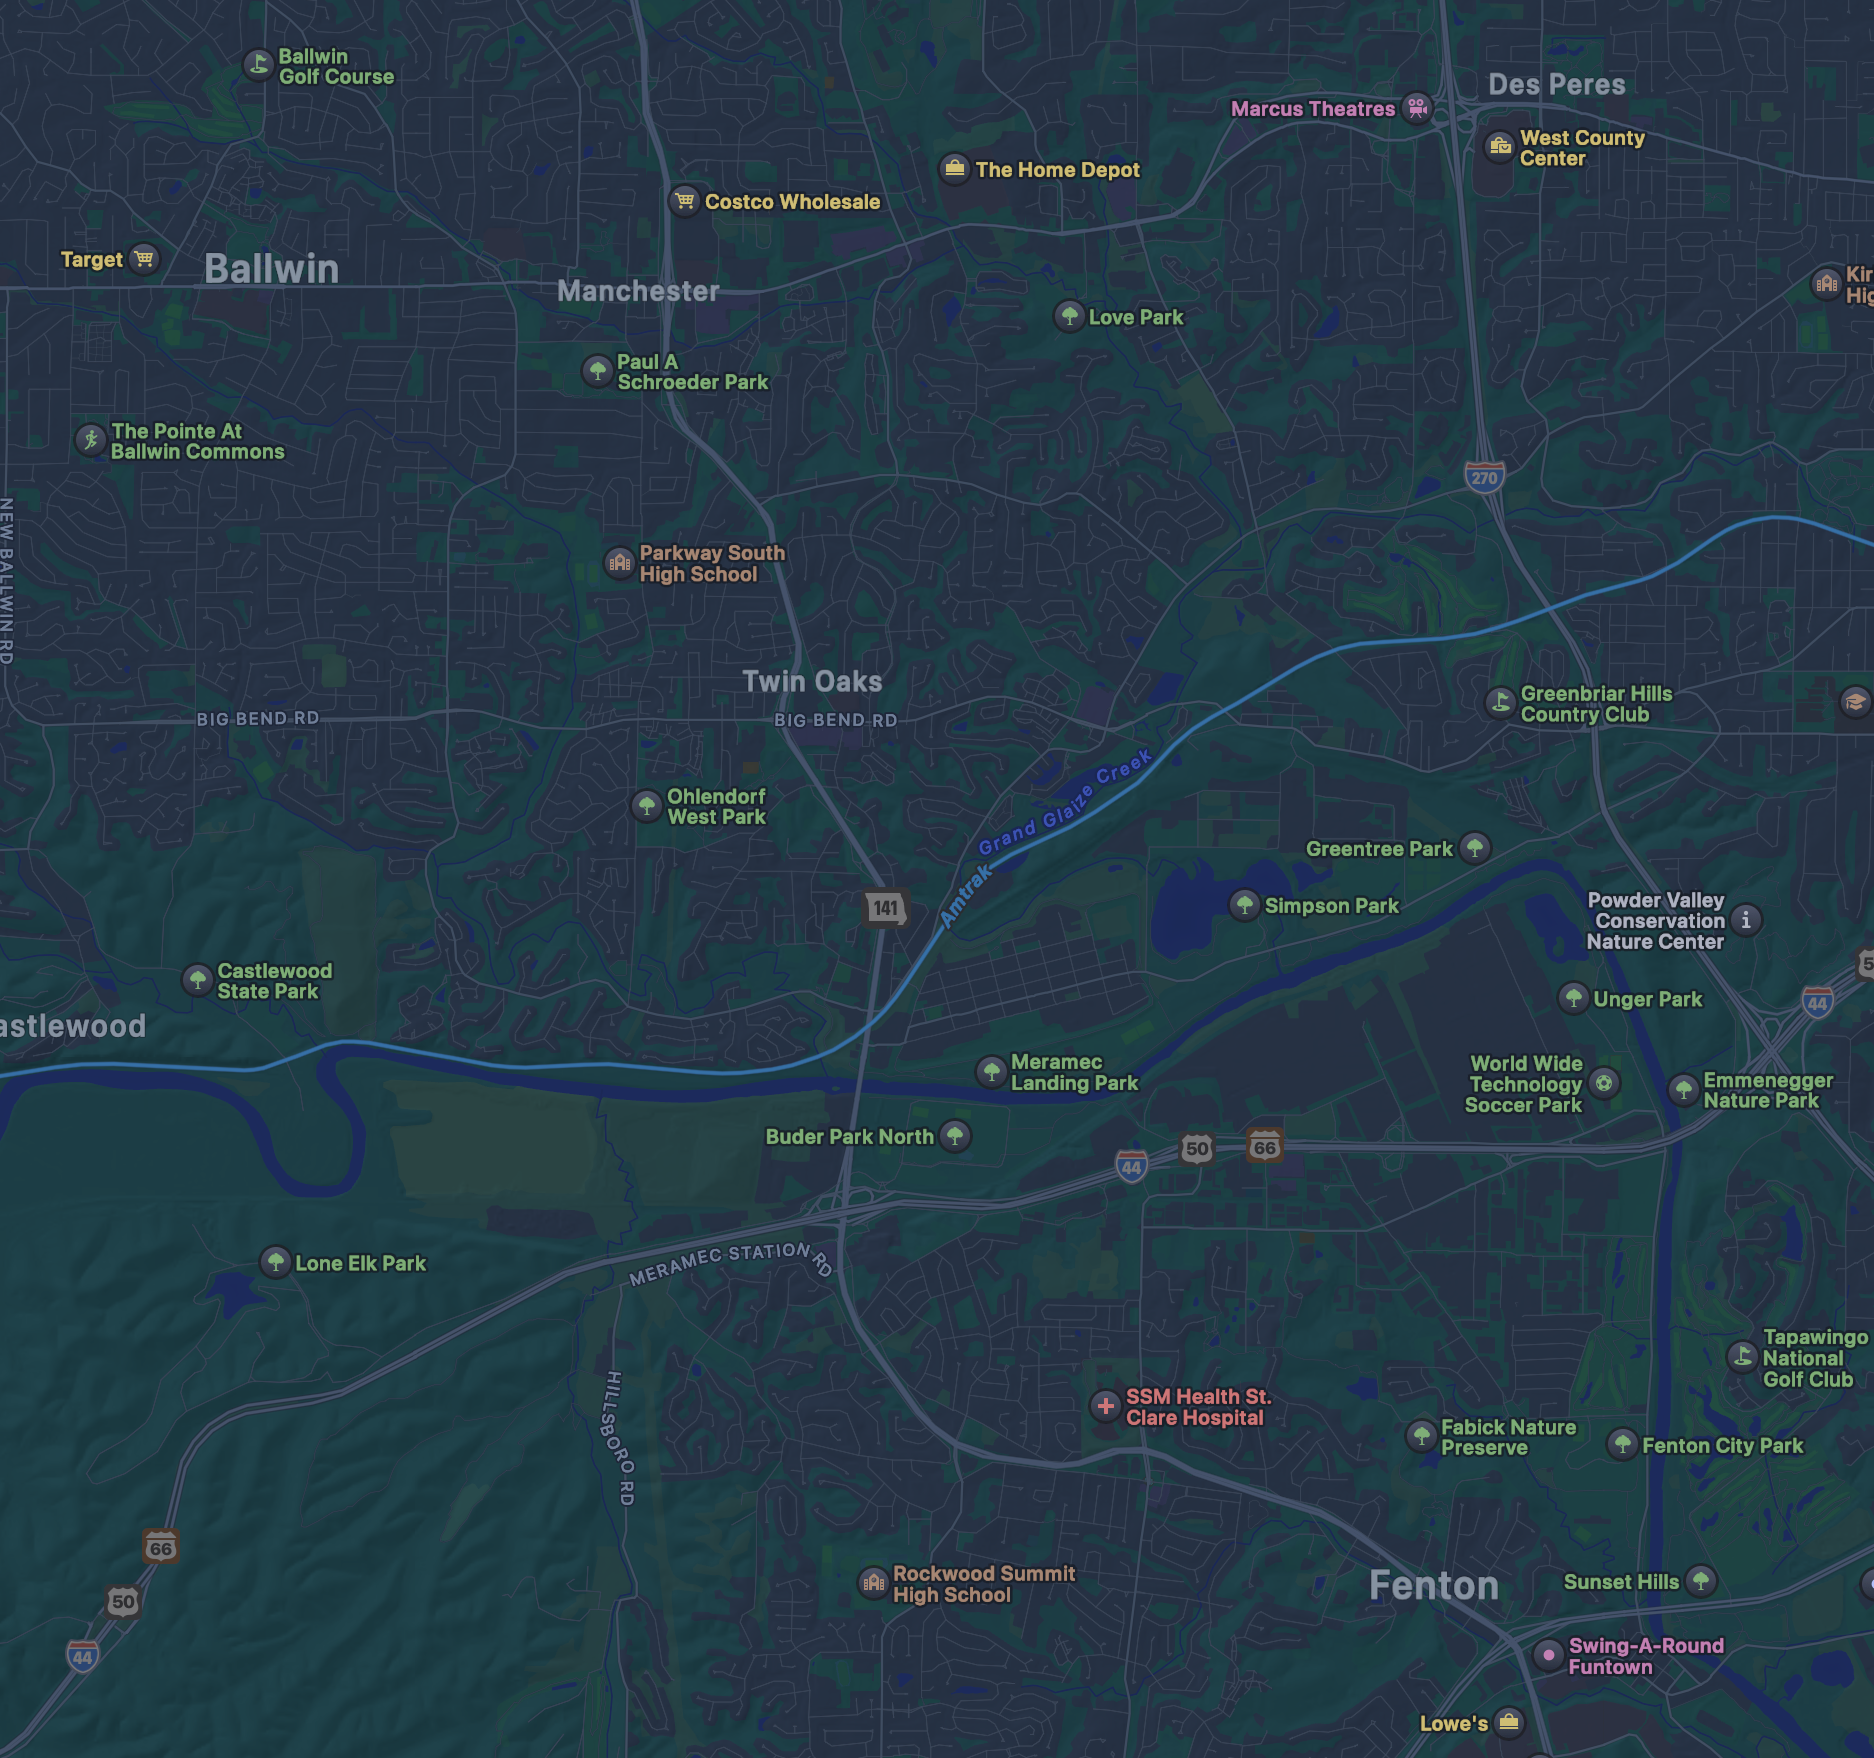
As for internally, within the city: Frankly, I think city-country fingers in Salt Lake would simply be odd patches of shitty desert brush and dust. Trying to visualize a more fractal, integrated example of this pattern, I did a bit more exploring in places I’ve lived previously.
I grew up in St. Louis, near the Ballwin/Manchester areas. If there’s one thing that feels substantially different between here and there, it’s the trees and rivers. From what I can tell, natural water features make up the trunk of the fingers, and the trees make those fingers worth keeping. I think city/country fingers makes more sense when good natural settings are actually part of the ecology of the place you live.
Footnotes
-
I’m not doing good statistics, here. The change in the question makes the comparison I do here slightly irresponsible. the modern
ruralcould easily map to 1972’ssmall townorfarmcategories, so the data may be wonky. This is why it’s a really big deal when questions change, and why responsible longitudinal data analysis requires very special care. Folks doing econometrics are trained on exactly how to handle this — and if I was doing this for a real analysis, I’d take that same level of care. However, I’m not interested in having all 253 patterns take me two hours to write, so we’re gonna breeze write past these concerns and cosplay as real statisticians. ↩