Annotations
QUOTE
Carolyn R. Bertozzi
Some context — Dr. Bertozzi was one of the the 2022 Nobel Laureates in Chemistry for her contributions to developing click and bioorthogonal chemistries.
UPDATE
My partner did review my annotations on this paper, and the previous explanation of click chemistry comically missed the mark. “Comically” isn’t a hyperbole — she literally laughed in my face.
I’ve removed the original elaboration on click chemistry from the live site. Although this paper does have Bertozzi as the most senior author, it has nothing to do with click chemistry. Oops!
QUOTE
Fig. 2 | Structure-guided engineering of StcE yields mutants of reduced activity, binding and size. a, Structure of StcE, as predicted by ColabFold (Methods)62, with the C domain (purple) and INS domain (blue) highlighted. The Zn2+ active site is depicted in orange, while mutated residues are shown in teal.
This is where my interest piques, since I’d need to bug my partner for ELI5 explanations of any of the research up to this point.
I’m here to know how exactly they used ColabFold for this particular problem domain. From the core ColabFold paper, there’s quite a few hyperparameters that allow us to make sure the model best matches the environment it’s seeking to emulate, as well as expose the relevant information for further study/replication/confirmation.
In a best-effort attempt to confirm this, I looked into the upstream paper referenced in the ColabFold method, where they are confirming the AlphaFold result with the upstream Yu et al. paper investigating StcE specifically. The associated data for that paper references 3UJZ: Crystal Structure Of Enterohemorrhagic E. Coli Stce, which — I think — is the experimentally-determined StcE structure. There’s an associated plaintext amino acid sequence that we can pop into a .fasta file and feed to localcolabfold and… hopefully just get the same structure this paper got, but with the full ColabFold statistical report?
Comparing the outputs of our run versus this paper’s run, then, we either do, or don’t get the same structure:
- If we do get the same structure, we can be fairly confident that this paper is also just using the default
localcolabfoldhyperparameters from their sample run, and have some comfort in continuing to use those hyperparameters in similar scenarios; or - If we don’t get the same structure, we can assume they used different hyperparameters that aren’t here, or in the supplementary materials, and we may need to reach out and ask what hyperparameters they used.
Well, it was audacious to expect a clear-cut answer here. After using localcolabfold under sample hparams to categorize the 3UJZ sequence, and coloring it to the same domain coloring map available at the NIH 3UJZ source, I’m getting… something vaguely similar. From the Relaxed, Rank 1 PDB:
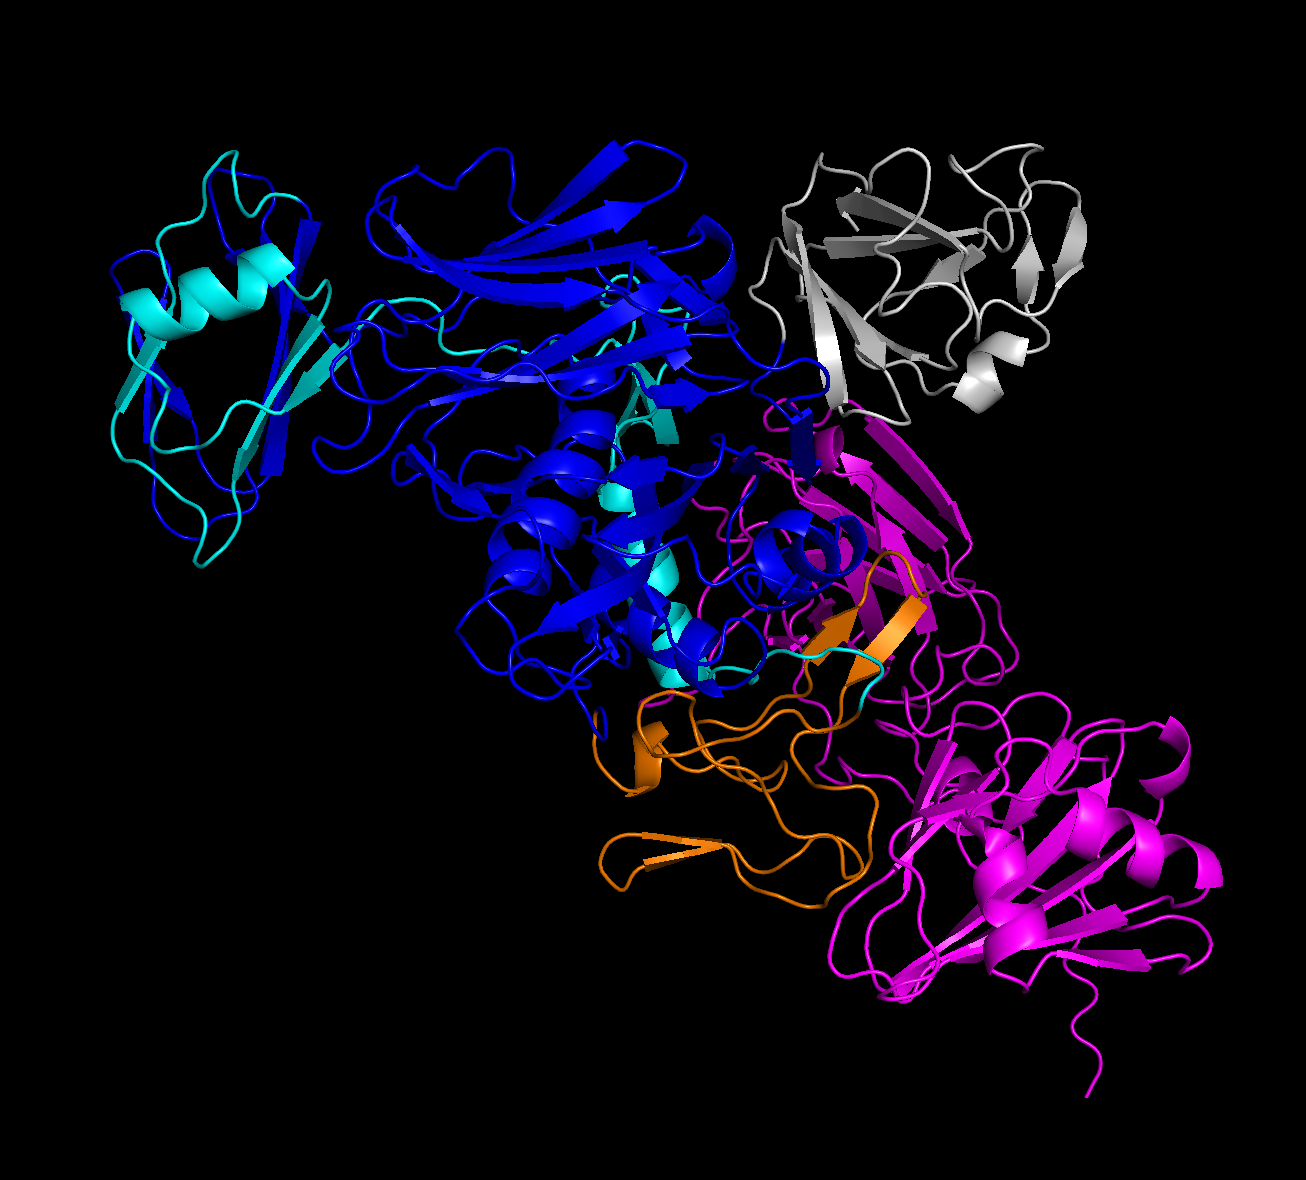
We’re about to get real fuzzy, here.
The Y shape demonstrated in the paper’s results does seem to be present, although not quite as cleanly as the sample figure. Additionally, my assumption (with fingers crossed) was that the C and INS domains were in the 5 domains from the NIH source. I’m not sure this ended up being the case.
As a more quantitative source that we do have a hub-and-spoke with three offshoots, though, we can take a look at the error graph:
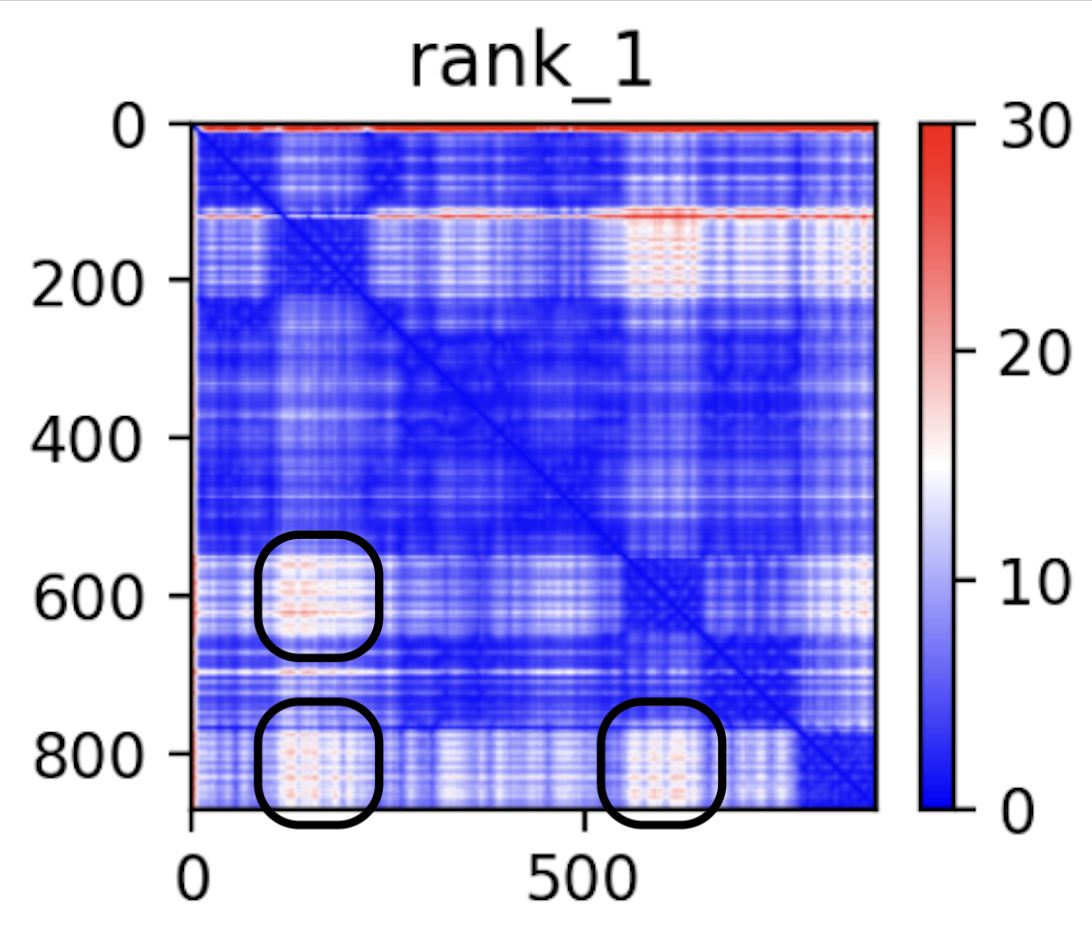
From my understanding on how to read this chart from the upstream ColabFold paper — specifically, the extended figure from the bioarXiv pre-print, areas that have low confidence per-model but high consensus across the models may correspond to generally flexible offshoots to the core rigid structure of the protein. If that’s a correct understanding, those three uncertain regions would correspond to three offshoots, two of which are likely the C and INS domains mentioned.
The best conclusion I can take away, then, is that the ColabFold defaults are likely good enough for cursory glances, but would need to be better understood.
My secondary conclusion, though, is that AlphaFold is generally a precursory/investigatory garnish that can assist in an exploratory phase. We can see here that it was used for just a handful of figures, to visually highlight important information, but is (obviously) no substitute for experimental evidence. It’s a pair of binoculars to look closer at where you’re headed, not the thing that gets you there.
QUOTE
d, Setup for flow cytometry assays measuring cell-surface activity and binding of StcE and StcE mutants. e, Representative flow plots showing surface MUC1 levels of HeLa cells treated with StcE mutants at the indicated concentrations. For flow plots of all other StcE mutants, see Supplementary Fig. 1d.
(This annotation has nothing to do with 4d — I’m just placing it here for its proximity to figure 4a)
After reviewing this annotation set with my partner, she did point me in the right direction (read: she actually read the upstream paper and told me exactly what I was missing. Nerd.)
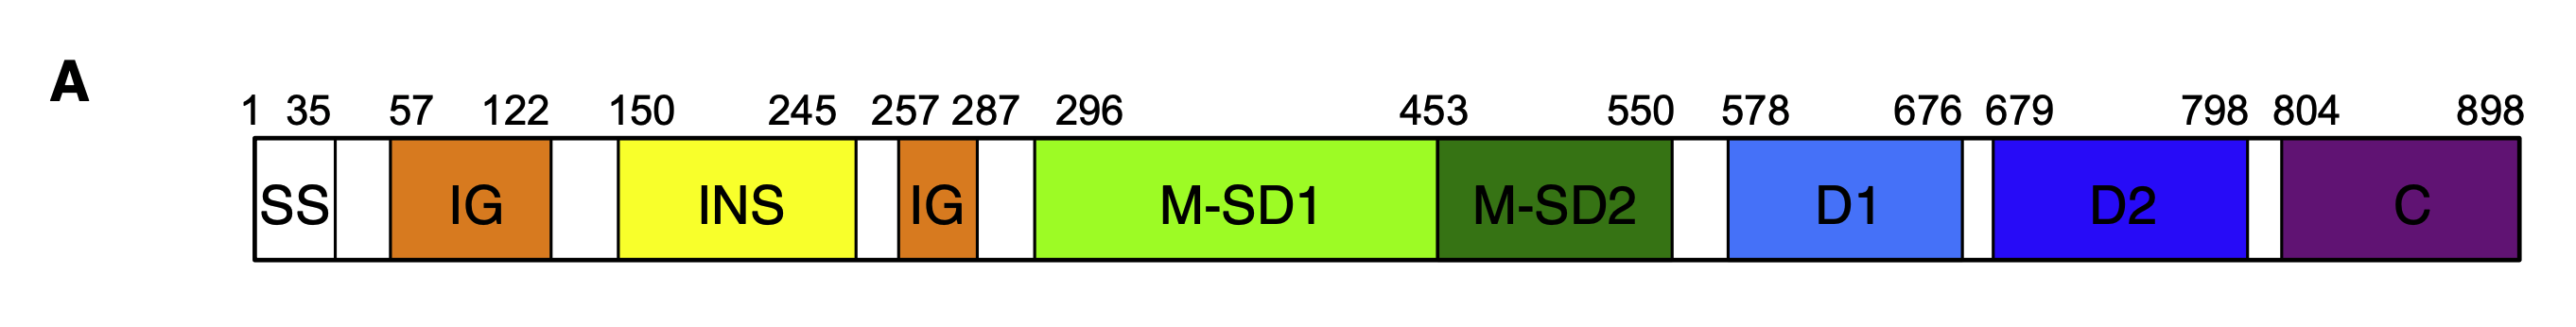
From up upstream paper, they do highlight domains differently than the NIH structural source does — the NIH source also has a beginning sequence, called the signal sequence (SS), chopped off of it (we think):
QUOTE
She was very nice, and reconstructed the amino acid sequence based on the StcE DNA sequence. What we found is that the upstream NIH source is weird. From the beginning of that sequence:
QUOTE
GSHMASADNNSA…
Paraphrasing her, the “important” part of the sequence starts after the MAS sequence. I asked her why this is the case, and she gave me a very long, well-researched answer. When I asked her to dumb it down for me, she said it’s “because of the way proteins are.” I’ll take her word for it.
For our purposes, we can trust that everything before (and including) MAS is the signal sequence, which this paper cut off prior to the fold. While I didn’t do that, the preceding GSHMAS sequence probably won’t effect the fold very much. However, it does let us know that we need to do some offset math when highlighting the domains in the same way Yu et al. does. We know that the sample we folded only cut off 29 of the 35 SS-domain amino acids, so we need to offset all of the highlights by 29.
Doing that math, then, the two subsequences we need to highlight are:
- INS Domain: [121, 216]
- C Domain: [775, 869]
Using these domain sets gives us a FAR clearer picture than we had, before:
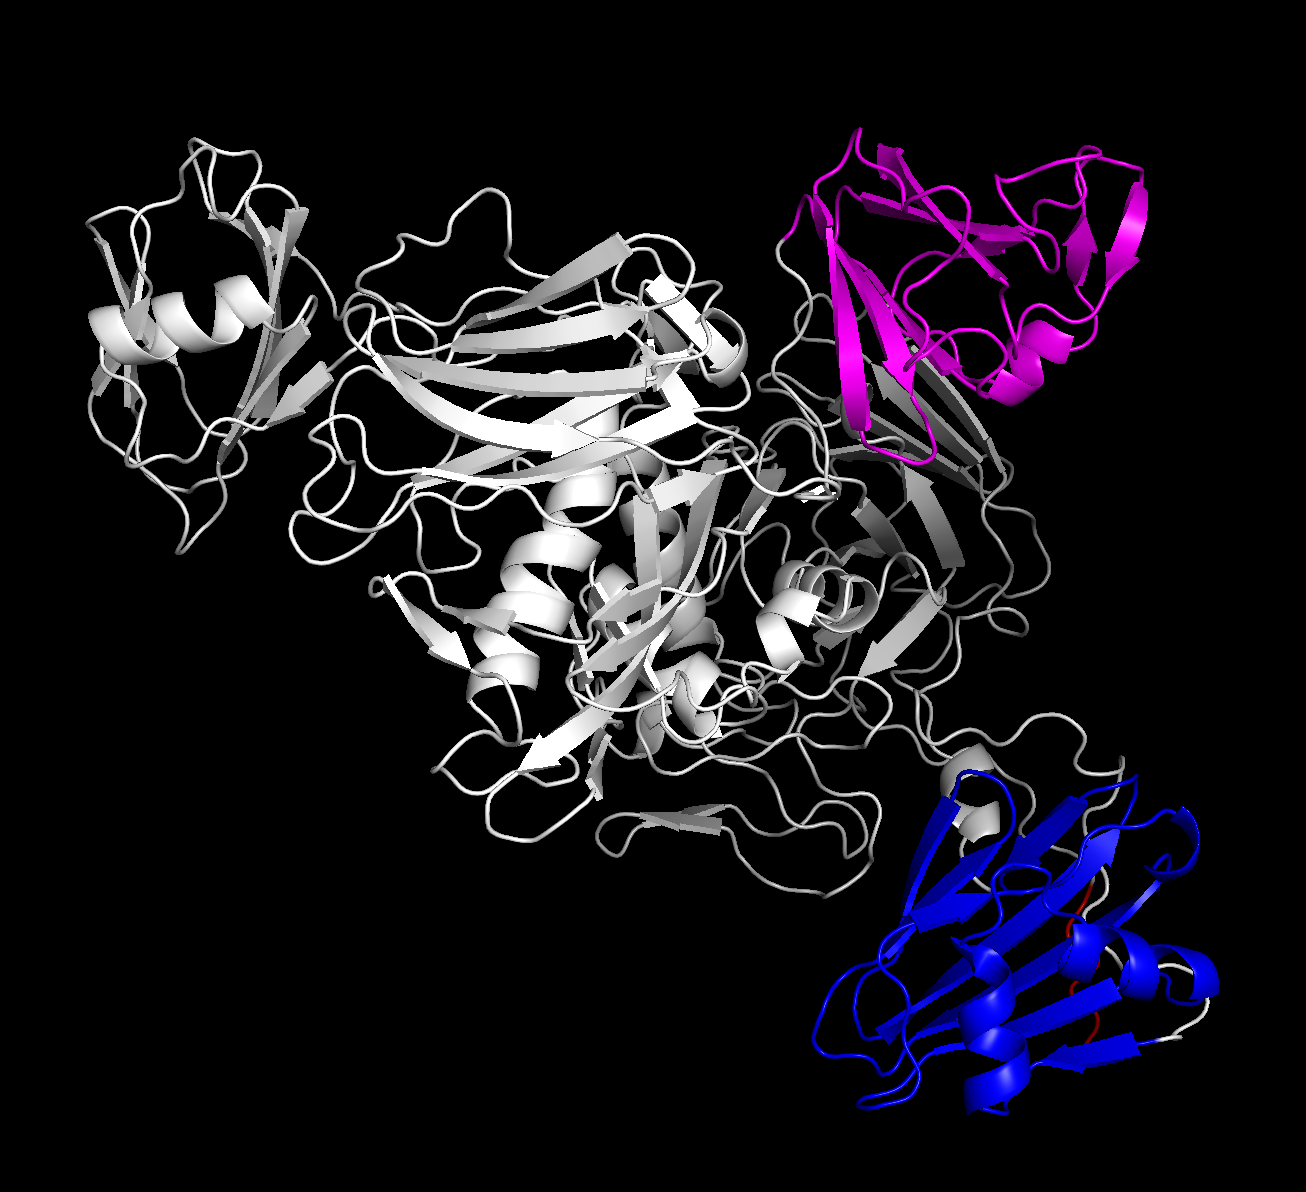
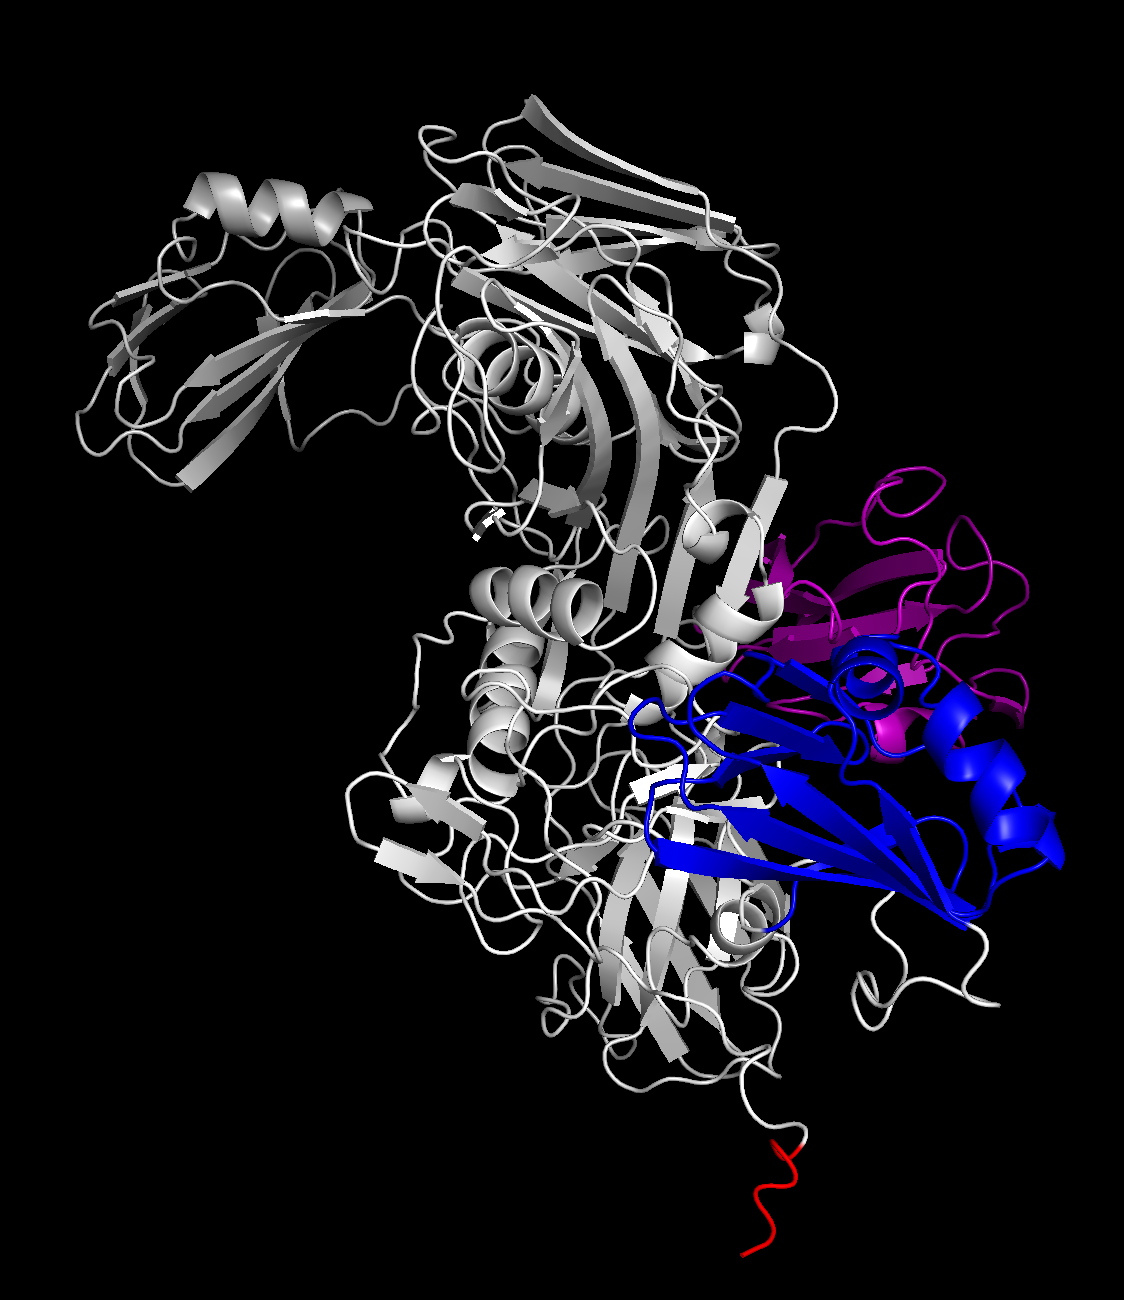
(the extra red highlight is the GSHMAS erroneous part of the sequence that we were un-offsetting for — given that it’s in a tail offshoot, I’m not too concerned about it affecting the rest of the fold.)
The differences in angles between the three loose domains against the core rigid body is expected — those were the sources of uncertainty on the graph above, which is still correct. However, this is confirmation that the C and INS domains are correctly confined to the spokes of the protein. I think that the second, rotated figure also gives a strong confirmation — the shape is close enough that, if I was the type of person qualified to guesstimate, I’d be able to loosely point out where the mutated residues and Zn^2+ active sites were, in a pseudo-academic pin-the-Zn^2+-active-sites-on-the-protein-donkey kind of way.
I feel far more settled than before that the fold they did here were using the default ColabFold hyperparameters. I do wish they posted their output config.json, as that’d settle any speculation on the matter. However, my partner tipped me off to two academic courtesies:
- When you have questions on a paper, it is standard to email the last (most senior) author on the paper. That’s why Bertozzi’s name is the only one in the authorship line with an email icon next to it.
- I should not, under any circumstance, cold-email 2022 Nobel Laureate Dr. Carolyn R. Bertozzi asking for a
config.jsonfrom three years ago.
This likely closes out the replication investigation. The default hyperparameters can give close enough results that, given we’re dealing with a statistical model, I’d be willing to thumb it and say we’re close enough. However, this is not a lock on extended data from ColabFold — which, if I understand correctly, is how things like active sites can be investigated from ColabFold output. Perhaps this is where it ends, perhaps not. It is, however, as far as I’m going to dig into this particular set of annotations.
Y’all are about to see me do my best, again. This is a knock-on from the ColabFold annotations with a specific instance of ColabFold that somebody pointed me to. The same disclaimer applies — I’m not a computational biologist! This is due diligence, simply to make sure I’m understanding ColabFold the best I can while using it.